News
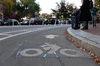
Cambridge Residents Slam Council Proposal to Delay Bike Lane Construction

News
‘Gender-Affirming Slay Fest’: Harvard College QSA Hosts Annual Queer Prom

News
‘Not Being Nerds’: Harvard Students Dance to Tinashe at Yardfest

News
Wrongful Death Trial Against CAMHS Employee Over 2015 Student Suicide To Begin Tuesday

News
Cornel West, Harvard Affiliates Call for University to Divest from ‘Israeli Apartheid’ at Rally
"Dropped" Students at Harvard and at Yale.
For a good many years the adherents of Harvard and Yale have been familiar with the discussion of a statement of obscure origin, to the effect that though the admission requirements of Harvard College are confessedly higher than those of Yale College, the work of students in pursuing an academic course toward the degree of Bachelor of Arts ends in disappointment less often at Harvard than at Yale. The statement is commonly made in the form-"It is harder to get into Harvard College than into Yale, but once admitted, it is easier to stay there." The statistics printed below would seem to show that it is, putting it as mildly as possible, no easier to stay in Harvard.
In making this comparison the three latest possible classes at the two colleges have been treated, the classes of '94, '95 and '96. The class of '97 could not be taken as the number of its members who are to receive their degrees after five or perhaps after six years is not yet ascertainable. The time covered is from the fall of '90, when the classes of '94 entered the two colleges as freshmen, to the coming June, when a few stragglers from the classes of '96 may yet receive their degrees. The statistics deal only with the men entered regularly in one of the three classes at the beginning of the Freshman year of that class. Special students are of course not included in the list, nor is any mention made of men in the scientific schools of the two universities.
From the freshman classes as given in the catalogues are first eliminated the names of men who have entered college the preceding year and been dropped a class, and also those of men who have entered the class regularly, but who had been in their university the preceding year as special students and thus got a few courses to their credit. The first interesting comparison is in the number of men of the firet kind,- "dropped" freshmen. The large number of these men at Harvard shows the strict discipline of our college office, but is partly accounted for by our elective system which allows a man to divide his work unequally among the four years, if he desires, although at an increased risk of being temporarily dropped a class if he fails in any of it.
The statistics are remarkably alike but what difference there is points always to the greater difficulty of staying in Harvard. In the case of every class the figures show that a smaller percentage of Harvard men were able to get the degree in four years or less than was the case at Yale, the difference being 4-10 percent. in '94, 4 9-10 percent. in '95, and 3 per cent. in '96. In regard to the number of men getting their degrees in five and six years the statistics are again slightly in favor of Harvard, while the percentages of the men who left college without a degree is in all cases notably larger at Harvard than at Yale.
The statistics follow:
YALE. CLASS OF '94. HARVARD.
259 Size of Freshman class in catalogue. 366
8 From Freshman class of preceding year. 38
0 From Specials of preceding year. 1
251 or 100 per cent. Real size of entering class. 327 or 100 per cent.
202 or 80 1-2 per cent. Degrees in '94. 249 or 76 1-10 per cent.
0 or 0 per cent. Degrees in '93. 13 or 4 per cent.
13 or 5 1-10 per cent. Degrees in '95. 10 or 3 per cent.
2 or 8-10 per cent. Degrees in '96, 1 or 3-10 per cent.
34 or 13 1-2 per cent. Left without degrees 54 or 16 1-2 per cent.
YALE. CLASS OF '95. HARVARD.
268 Size of Freshman class in catalogue. 381.
7 From Freshman class of preceding year. 24
0 From Specials of preceding year. 4
261 or 100 per cent. Real size of entering class. 353 or 100 per cent.
214 or 81 9-10 per cent. Degrees in '95. 256 or 72 1-2 per cent.
0 or 0 per cent. Degrees in '94. 16 or 4 1-2 per cent.
16 or 6 1-10 per cent. Degrees in '96. 18 or 5 1-10 per cent.
1 or 3-10 per cent. Degrees in '97. 2 or 6-10 per cent.
20 or 11 4-10 per cent. Left without degrees. 61 or 17 2-10 per cent.
YALE. CLASS OF '96. HARVARD.
300 Size of Freshman class in cataloguc. 409
12 From Freshman class of preceding year. 12
0 From Specials of preceding year. 2
298 or 100 per cent. Real size of entering class. 395 or 100 per cent.
227 or 78 8-10 per cent. Degrees in '96. 293 or 74 1-10 per cent.
1 or 3-10 per cent. Degrees in '95. 8 or 2 per cent.
10 or 3 4-10 per cent. Degrees in '97. 12 or 3 per cent.
0 or 0 per cent. Possible degrees in '98. 2 or 1-2 per cent.
50 or 17 3-10 per cent. Left without degrees. 80 or 20 2-10 per cent.
Want to keep up with breaking news? Subscribe to our email newsletter.